
Cracking The Code of Chance:Exploring Probability with Each Roll Of A Dice

Name: Tonique Gordon
Date: October 4, 2023
Abstract: This document outlines a probability experiment, centered around the rolling of a pair of dice 100 times. The dice have six sides each with numbers ranging from 1 to 6. After rolling the dice 100 times data was collected namely: what number each die landed on, the sum of each roll, the frequency of each sum and the percentage. The gathered data was presented on a data table that documented the frequency of each possible sum. A visually informative pie chart was used to show the proportional distribution of each sum within the dataset. In my hypothesis I stated that I believed the sum of 5 would be the most common sum. My hypothesis was proven incorrect from the data I collected. The experiment revealed interesting findings about probability. The sum of 5, occurred 14 times, making up only 14% of the 100 rolls. The highest sum recorded was 7, occurring a total of 18 times, accounting for 18% of the 100 rolls. The lowest possible sum, 2, was rolled 0 times of the 100 rolls, yielding a probability of zero percent. This experiment showed that a sum of 7 had the highest probability of being rolled and a sum of 2 had the lowest probability of being rolled.
Introduction
Is anything by chance? Do things just happen randomly? Can we predict how things will happen? How do we know if things are truly random? Can we know if things are truly random? The concept of probability has long captivated the human mind. It comes from our innate desire to untangle the mysteries of chance. We naturally desire to comprehend the inner workings of the world around us. We want to decode the intricacies of randomness in order to predict when and how events will happen, and to what extent will that event happen. Our pursuit to understand chance is relentless, which leads us to undergo tasks repeatedly, searching for patterns to provide understanding into the mechanisms governing these occurrences. In this laboratory, we do just that. I will state that my hypothesis, the sum of 6 would be the most common sum. We will however dive into a journey to see if this is true. Our goal is to explore the likelihood of each role, documenting our findings for examination. Through the analysis of our collected data, we aim to find the hidden patterns that underlie this seemingly random act, shedding light on the fascinating world of probabilities. Join me in this journey as we try to understand the concept of “probability” uncovering the secrets of each dice roll, revealing the intricacies of chance.
Materials
- A pair of virtual dice
- A computer
- A google sheet document
Methods
- Creating a google sheet.
- Label the first column die1, second column die 2. On these columns collect the number rolled for each die. The third column will be labeled sum of dice 1 & 2 and collect the sum of dice 1 & 2 here.
- Google a virtual dice roller on your computer. Roll the virtual dice 100 times.
- Add the values and collect the data on the google sheet
- Create a second google sheet. Label a row 2-12, label a column frequency of dice rolled and collect the data there.
Results
The data shown below examines the probability of each roll of a dice. The sum of 7 has the highest probability of being rolled according to the data I collected, while the sum of 2 had the lowest probability. Documented in Table 1, which records the frequency and combination of each sum, the sum of 7 was rolled a total of 18 times, while the sum of 2 was rolled 0 times. On Chart 1, a pie chart documenting the percentage distribution of sums, the sum 7 made up 18% of the 100 rolls, while the sum 2 made up 0% of the 100 rolls.
Table documenting the frequency and combination of each sum
| Sum rolled | Combinations | Frequency |
| 2 | 0 | 0 |
| 3 | (2,1)(1,2) | 8 |
| 4 | (2,2)(3,1)(1,3) | 9 |
| 5 | (3,2)(2,3)(4,1)(1,4) | 14 |
| 6 | (1,5)(5,1)(3,3)(4,2)(2,4) | 17 |
| 7 | (3,4)(1,6)(4,3)(5,2)(2,5) | 18 |
| 8 | (2,6)(6,2)(4,4)(5,3)(3,5) | 12 |
| 9 | (6,3)(5,4)(4,5)(3,6) | 10 |
| 10 | (6,4)(5,5)(4,6) | 7 |
| 11 | (6,5)(5,6) | 4 |
| 12 | (6,6) | 1 |
Pie chart documenting sum percentage
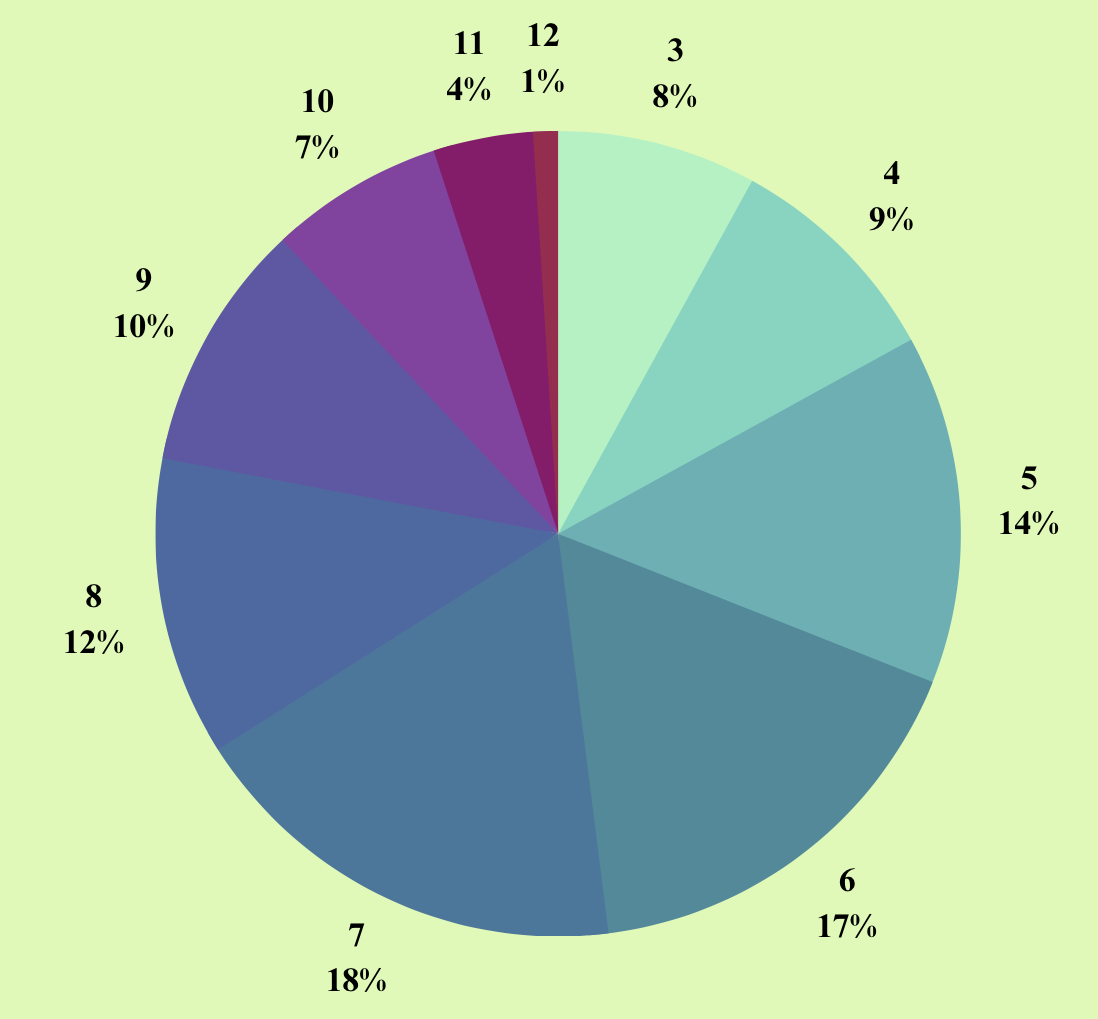
Chart 1.
Analysis
After conducting my experiment and compiling my data, this experiment showed that out of 100 dice rolls, the sum of 7 was the highest sum rolled. Documented in Table 1, the number 7 was rolled 18 times, making up 18% of the 100 rolls, as shown on Chart 1. The second highest sum rolled was the sum of 6, which occurred 17 times, constituting 17% of the 100 rolls. The second lowest sum rolled was 12, making up only 1% of the 100 rolls. The sum of 2 was never rolled, accounting for 0% of the sums out of 100 rolls. My hypothesis, which predicted that the sum of 6 would be the most frequent, was proven to be incorrect by my experiment. Although the sum of 6 accounted for a significant portion of the sums rolled, occurring a record 17 times (17% of the 100 rolls), my hypothesis was very close, differing by only 1%. My rationale behind hypothesizing that the sum of 6 would be the highest rolled sum was based on the number of combinations that could result in the sum of 6. There are five different combinations that can be rolled to achieve a sum of 6: (1,5), (5,1), (3,3), (4,2), and (2,4). With the variety in combinations I thought for sure 6 would be the highest sum.
In the study, Golden Arm: A Probabilistic Study of Dice Control in Craps by Donald R. Smith and Robert Scott III, a similar study on dice probability was conducted. The aim of the study was to develop a mathematical formula capable of predicting the sum of dice rolls in the game of craps. In this study, the sum 7 was the most frequently rolled sum out of 36 possibilities. There was a 6/36 or 16.67% probability that the sum 7 would occur. Similarly, the sum of 6 had the second highest probability of being rolled, accounting for 5/36 or 13.89% of the rolls. These results are very similar to the ones I compiled.
Conclusion
My primary objective in conducting this experiment was to determine which sum had the highest probability of being rolled. Initially, I hypothesized that the sum of 6 would be the most frequently rolled. To test my hypothesis, I rolled a pair of six-sided dice, each numbered from 1 to 6, and recorded the outcomes, then I organized the data into a chart and table for analysis. Upon analyzing the results, I was able to see that my hypothesis was incorrect but very close. The sum with the highest probability of being rolled turned out to be 7. This sum occurred 18 times, constituting 18% of the 100 rolls. The sum I had initially predicted, which was 5, appeared 14 times, accounting for 14% of the 100 rolls.
References
Smith, D. R., & Scott, R. (2018). Golden Arm: A Probabilistic Study of Dice Control in Craps. UNLV Gaming Research & Review Journal, 22(1). Retrieved from https://digitalscholarship.unlv.edu/grrj/vol22/iss1/1